Team DARKLEASH | 29 November 2023 | 104 MB
英文简介:
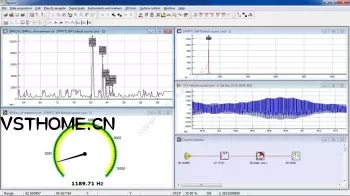
SIGVIEW is a versatile signal analysis software package that offers both real-time and offline capabilities. It comes equipped with a wide array of powerful tools for signal analysis and statistical functions, all complemented by a comprehensive visualization system. The software is designed to be highly customizable and flexible, and does not require programming knowledge to use effectively.
Philosophy
SIGVIEW offers a distinct user interface and approach to signal analysis, providing users with complete freedom to combine a range of methods in any way they see fit. The software is not limited by artificial rules or constraints, allowing for ultimate customization and flexibility. Once users become familiar with the software's fundamental principles, navigating SIGVIEW becomes intuitive and straightforward.
Features
?Two versions available: STANDARD and PRO, with different prices and feature levels.
?Support for a wide range of data acquisition devices, from common sound cards to professional DAQ devices. Various options for triggering, decimation and file-logging are included. The following device types are supported
?NIDAQmx compatible DAQ devices from National Instruments? (voltage input, IEPE velocity/force/acceleration)
?Measurement Computing? DAQ devices (12/16/24-bit voltage input)
?LabJack? U3/U6/T4/T7/T8 USB/Network DAQ devices (voltage input)
?Some Data Translation? DAQ devices (DT9837 series)
?Microsoft Windows? compatible sound cards (DirectSound and ASIO drivers are supported)
?Real-time data display, signal analysis, and control, enabling you to work with live signals and observe results immediately.
Import and export of signal files in numerous formats, including WAV, MP3, ASCII/CSV, WMA, AU, AIFF, EDF, SND, and 8/16/32-bit binary files
Julia Language embedded scripting for adding new analysis functions or input/output formats
Optimized FFT algorithm with fine parameter tuning and various pre and postprocessing options: windowing, zero-padding, power spectrum and PSD, automatic averaging, test for spectral peaks integrity…
?Spectrogram and Time-FFT functions with powerful graphical display solutions
?Order Analysis functions, including forward and inverse transformations
?Dual channel (cross-spectral) analysis (cross spectrum, coherence, cross correlation…)
?Signal filtering (Bandstop, Bandpass, Lowpass, Highpass)
?3D signal filter for a free selection of filter time, frequency and amplitude properties
?Real-time arithmetic on signals (subtract, multiply, add, scale, normalize…)
?Various statistics functions: peak hold, averaging, smoothing, removing linear trend, probability distribution… Analog-style instruments for real-time display of important signal parameters
?Custom filter curves can be freely defined and applied directly to time-domain signal or to the calculated spectrum
Advanced signal display and handling options: unlimited overlays, unlimited number of markers and annotations for each signal, parallel signal display (EEG style), cut/copy/paste signal parts, unlimited zoom levels, audio playback…
Signal generator including sine, white and pink noise, step, sweep…
Graphical block diagram environment improves productivity when working with complex analysis systems
Custom tools and workspaces can be created and later reused or exchanged with other SIGVIEW users
Various command-line options for automation and remote control from external applications or from simple batch files
No artificial or license-based limitations, enabling FFTs to be calculated from millions of samples and dozens of signals to be combined and analyzed simultaneously.
Field-proven by thousands of satisfied users. See our Reference list for some examples.


评论0