P2P / 2017 / 33.4 Mb
英文简介:
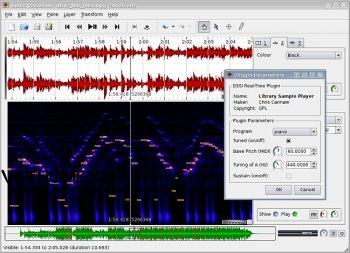
Sonic Visualiser is an open-source audio analysis and annotation utility that displays the waveform of a music file, enabling you to get an insight of what is behind the output sound.
Variate format support and importing capabilities
Mainly addressed to music technicians, it can display a graphical representation of the audio signal for each channel and annotate loaded data for easier identification of segments.
It aims to provide a user-friendly tool for displaying spectograms and audio waveforms, ensuring compatibility with some of the most common audio formats (such as WAV, MP3, AIFF, AVR, FLAC, OGG, RAW), as well as less popular file types (AU, CAF, HTK, IFF, MAR, MPC, PVR, RF64, SDS, W64, WVE, XI). Moreover, it enables you to import musical note data from locally stored MIDI files and display it alongside the waveform.
Visualization, comparison and annotation
The application features options for modifying the way data is displayed. As such, you can freely adjust the zoom level both horizontally and vertically, so as to focus on any area of the waveform and analyze it in detail.
The selection tools enable you to define waveform sections and compare them much easier. For your convenience, Sonic Visualiser can also slow down the playback to such an extent that it reaches 10% of the initial speed.
One of the worth-mentioning features is the possibility to import and overlay annotation layers (CSV, LAB, MID, TXT) on top of waveform representations. Furthermore, it comes with a set of integrated plugins that allow automatic calculations of annotations, taking into account tuning and sound pitch.
Explore the content of audio files
Sonic Visualiser enables you to explore and get close-ups on the structure of an audio file, providing advanced annotation options to help you write down your findings. It comes with a broad tool set and options for managing spectrum data and layers, allowing audio playback and signal comparison.
FEATURES
? Load audio files in WAV, Ogg and MP3 formats, and view their waveforms.
? Look at audio visualizations such as spectrogram views, with interactive adjustment of display parameters.
? Annotate audio data by adding labelled time points and defining segments, point values and curves.
? Overlay annotations on top of one another with aligned scales, and overlay annotations on top of waveform or spectrogram views.
? View the same data at multiple time resolutions simultaneously (for close-up and overview).
? Run feature-extraction plugins to calculate annotations automatically, using algorithms such as beat trackers, pitch detectors and so on.
? Import annotation layers from various text file formats.
? Import note data from MIDI files, view it alongside other frequency scales, and play it with the original audio.
? Play back the audio plus synthesized annotations, taking care to synchronize playback with display.
? Select areas of interest, optionally snapping to nearby feature locations, and audition individual and comparative selections in seamless loops.
? Time-stretch playback, slowing right down or speeding up to a tiny fraction or huge multiple of the original speed while retaining a synchronized display.
? Export audio regions and annotation layers to external files.
What's New
? Improve decisions about where and how to label vertical scales
? Update build support material and documentation to reflect the official release of Cap'n Proto 0.6 (which we can now use rather than depending on git builds)
OS: Windows XP / Vista / 7 / 8 / 10 (32/64-bit)
官网: http://www.sonicvisualiser.org/index.html


评论0